Sidereal Day
The Movement of the Sky as seen from Durham
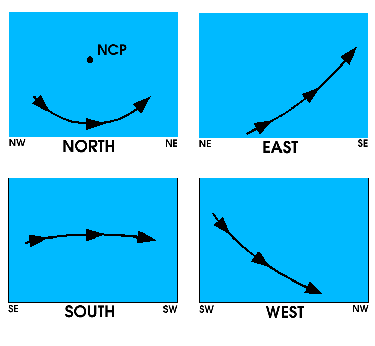
Durham: South, West, North, East
South Pole, Lat. = −60°, Lat. = −30°, Equator, Lat. = +30°, Durham, North Pole
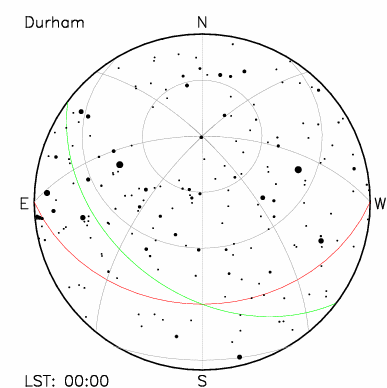
This animation shows the movement of the sky as seen from Durham (latitude = +55°) during the course of one rotation of the Earth, i.e. one sidereal day. The animation shows the whole sky. The thick black line is the horizon. The southern horizon is at the bottom and the northern horizon is at the top. The eastern horizon is on the left and the western to the right. The actual sky is a hemisphere and so there is some distortion as this is projected on the 2D animation. The clock in the lower left-hand corner shows the Local Sidereal Time. Over the course of one sidereal day the celestial sphere rotates once around the observer with objects rising in the East and setting in the West.
The grey lines are the RA-Dec grid of the celestial sphere; RA lines are shown every 3 hours ( 0, 3, 6, 9, 12, 15, 18, 21 ), Dec lines are shown every 30° ( −30°, 0° (celestial equator: red line), +30°, +60° ). The green line is the ecliptic ( = the apparent annual path of the Sun on the celestial sphere). The ecliptic plane is tilted 23.5° with respect to the plane of the celestial equator since the Earth’s spin axis is tilted 23.5°. Note the relationship between the LST and intersection of the celestial equator and the ecliptic lines. The LST reads 00:00 when this intersection (with the rising ecliptic line) crosses the meridian. The pole star (Polaris) can be seen at Dec = 90°, at the north celestial pole (NCP). The animation starts at a Local Sidereal Time (LST) of 0 hours, i.e. RA = 0h is on the southern meridian.
So from Durham we see the following motions of objects in the sky:
Current whole sky chart for Durham which shows the location of the Sun, Moon and planets as well as the stars is available from Heavens-Above.